Sometimes you just want to record results from a SQL query into Telegraf so you can graph it over time with Grafana. I have several queries that I want to see trend data for so I wrote this script to allow me to easily configure queries and throw them into a nice graph for analysis.
For the collection part I have a simple python script. I put the following in /usr/local/sbin/check_mssql.py
#! /usr/bin/env python

__author__ = 'Eric Hodges'
__version__= 0.1

import os, sys
import pymssql
import json
import configparser

from optparse import OptionParser, OptionGroup

parser = OptionParser(usage='usage: %prog [options]')
parser.add_option('-c', '--config', help="Config File Location", default="/etc/mssql_check.conf")

(options, args) = parser.parse_args()
config = configparser.ConfigParser()
config.read(options.config)

settings = config['Settings']
conn = pymssql.connect(host=settings['hostname'],user=settings['username'], password=settings['password'], database=settings['database'])

def return_dict_pair(cur, row_item):
    return_dict = {}
    for column_name, row in zip(cur.description, row_item):
        return_dict[column_name[0]] = row
    return return_dict

queries = config.sections()

items = []

for query in queries:
    if (query != 'Settings'):
        cursor = conn.cursor()

        cursor.execute(config[query]['query'])
        description = cursor.description

        row = cursor.fetchone()
        while row:
            items.append(return_dict_pair(cursor,row))
            row = cursor.fetchone()

conn.close()
print(json.dumps(items))

sys.exit()
<span id="mce_SELREST_start" style="overflow:hidden;line-height:0;"></span>
This script expects to be passed a config file on the command line i.e. ‘check_mssql.py –config test.conf’
The config file is very simple, it contains a Settings section with the database connection options, and then one section for each query you want to run. It runs the query and then converts the rows into a dictionary, then pushes each row onto an array. It repeats for each query adding them all to the same array and finally returns them as JSON. (Replace the right hand side of the = with the correct info). The query needs at least one column to be a string to serve as the key for telegraf.
Example test.conf config:
[Settings]
hostname=server[:port]
database=database_name
username=readonly_user
password=readonly_user_password

[Sample]
query=SELECT measurement, data FROM sample_table
You can make new section like Sample with different names and different queries and it will run them all and combine them together.
Then all we need to do is setup Telegraf to run this config (/etc/telegraf/telegraf.d/sample.conf):
[[inputs.exec]]
commands = ["/usr/local/sbin/check_mssql.py --config /etc/check_mssql/sccm.conf"]
tag_keys = ["measurement"]
interval = "60s"
data_format = "json"
name_override = "Sample"
Make sure to change the tag_keys and name_override to whatever you would like to be tags in Grafana. You can test the config by running ‘telegraf -test -config sample.conf’
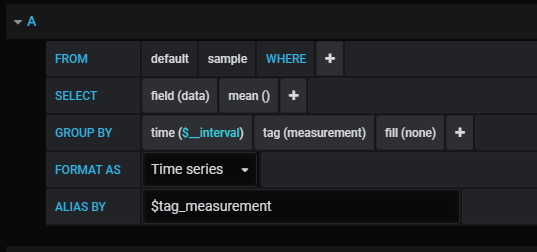
Now in grafana choose your telegraf data source, then set the where to any tags you want, select one (or more of the fields) and off you go.
I hope you find this useful and can make many great graphs with it!
