Tag Archives: Python

Python OAuth2 auth and bearer token caching

To access many APIs you need to use OAuth2, sending a client id and secret to an endpoint to get a token back. Then send that token with future calls as authentication.

The particular API I was calling would also return a number of seconds the bearer token would be good for.

Hopefully this code will help jumpstart someone else along the way to using python and APIs.

#!/usr/bin/env python3

import requests
import json
import datetime

import os.path
from os import path

cache_file = "/var/tmp/oauth.json"
client_id = '**your client_id here**'
client_secret = '**your secret here**'

def getToken():
    url = "https://api.wherever.com/oauth2/token"

    data = {
      'client_id': client_id,
      'client_secret': client_secret,
      'grant_type': 'client_credentials'
    }

    response = requests.post(url, data=data)

    data = json.loads(response.text)
    expiration_time =  datetime.datetime.now() +  datetime.timedelta(seconds=data['expires_in'])
    data['expiration_date'] =   int(expiration_time.utcnow().timestamp())

    with open(cache_file, "w") as outfile:
        json.dump(data, outfile)
    return data


if path.exists(cache_file):
    #Reading cache
    with open(cache_file, "r") as infile:
        access_token = json.load(infile)
    if int(datetime.datetime.now().timestamp()) > access_token['expiration_date']:
        #Token expired, get new
        access_token = getToken()
else:
    #No cached value, get and cache
    access_token = getToken()


bearer_token = access_token["access_token"]
headers = {
        'Authorization': f'bearer {bearer_token}'
}

#The rest of the requests go here and pass that header

4/24/2023: updated to fix typo!

Collecting MS SQL Query Data into Telegraf

Sometimes you just want to record results from a SQL query into Telegraf so you can graph it over time with Grafana. I have several queries that I want to see trend data for so I wrote this script to allow me to easily configure queries and throw them into a nice graph for analysis.

For the collection part I have a simple python script. I put the following in /usr/local/sbin/check_mssql.py

#! /usr/bin/env python

__author__ = 'Eric Hodges'
__version__= 0.1

import os, sys
import pymssql
import json
import configparser

from optparse import OptionParser, OptionGroup

parser = OptionParser(usage='usage: %prog [options]')
parser.add_option('-c', '--config', help="Config File Location", default="/etc/mssql_check.conf")

(options, args) = parser.parse_args()
config = configparser.ConfigParser()
config.read(options.config)

settings = config['Settings']
conn = pymssql.connect(host=settings['hostname'],user=settings['username'], password=settings['password'], database=settings['database'])

def return_dict_pair(cur, row_item):
    return_dict = {}
    for column_name, row in zip(cur.description, row_item):
        return_dict[column_name[0]] = row
    return return_dict

queries = config.sections()

items = []

for query in queries:
    if (query != 'Settings'):
        cursor = conn.cursor()

        cursor.execute(config[query]['query'])
        description = cursor.description

        row = cursor.fetchone()
        while row:
            items.append(return_dict_pair(cursor,row))
            row = cursor.fetchone()

conn.close()
print(json.dumps(items))

sys.exit()
<span id="mce_SELREST_start" style="overflow:hidden;line-height:0;"></span>

This script expects to be passed a config file on the command line i.e. ‘check_mssql.py –config test.conf’

The config file is very simple, it contains a Settings section with the database connection options, and then one section for each query you want to run. It runs the query and then converts the rows into a dictionary, then pushes each row onto an array. It repeats for each query adding them all to the same array and finally returns them as JSON. (Replace the right hand side of the = with the correct info). The query needs at least one column to be a string to serve as the key for telegraf.

Example test.conf config:

[Settings]
hostname=server[:port]
database=database_name
username=readonly_user
password=readonly_user_password

[Sample]
query=SELECT measurement, data FROM sample_table

You can make new section like Sample with different names and different queries and it will run them all and combine them together.

Then all we need to do is setup Telegraf to run this config (/etc/telegraf/telegraf.d/sample.conf):

[[inputs.exec]]
commands = ["/usr/local/sbin/check_mssql.py --config /etc/check_mssql/sccm.conf"]
tag_keys = ["measurement"]
interval = "60s"
data_format = "json"
name_override = "Sample"

Make sure to change the tag_keys and name_override to whatever you would like to be tags in Grafana. You can test the config by running ‘telegraf -test -config sample.conf’

Now in grafana choose your telegraf data source, then set the where to any tags you want, select one (or more of the fields) and off you go.

grafana


I hope you find this useful and can make many great graphs with it!

Using Python,Telegraf and Grafana to monitor your Ethermine.org miner!

I have a couple mining computers going and compulsion to Grafana everything that comes along. So I wondered how hard it would be to track my miner with Grafana and it turns out, not hard at all.  I use ethermine and they actually provide an API that allows you to call it with your miners address and it returns all sorts of stats, they also have some of the best documentation I’ve seen, and a site to let you test calls to their API (https://api.ethermine.org/docs/)    Heading over there I found that I wanted to make calls to miner/{mineraddress}/currentStats to get the juicy information I wanted, the info I wanted was returned in JSON and it would be in the data key… Well that’s easy enough, it’s not the prettiest script, and it doesn’t check for errors but here it is

#!/usr/bin/env python
import json
import requests

key = '{mineraddress}'
url = 'https://api.ethermine.org/miner/' + key + '/currentStats'

stats = requests.get(url)

print json.dumps(json.loads(stats.text)['data'])

Replace {mineraddress} with your miner address, and run it, and there you go.

You should get something back similar to

{"averageHashrate": 26047453.703703698, "usdPerMin": 0.0006877163189934768, "unpaid": 6366263118749017, "staleShares": 0, "activeWorkers": 1, "btcPerMin": 8.165787167840064e-08, "invalidShares": 0 , "validShares": 29, "lastSeen": 1521771528, "time": 1521771600, "coinsPerMin": 1.3241101293724766e-06, "reportedHashrate": 25752099, "currentHashrate": 32222222.222222224, "unconfirmed": null}


Which shows that currently, I’m making 0.0006 $/minute so I’ll be rich very very soon!

Now all I needed was to get this into Grafana,  my current database of choice has been InfluxDB, mostly because that is what I’ve been using, and the current collector of choice Telegraf.

So I:

  1. Setup influxdb
  2. Created a database for telegraf
  3. Created a write user for telegraf
  4. Setup telegraf
  5. Configured telegraf to use its user and write to influxdb

With that all done (that is basic setup needed for Grafana and I will probably cover it some other time)

I needed a telegraf collector for ethermine.  I moved my ethermine script to /usr/local/sbin and changed then ran

chown telegraf ethermine.py

This might not be the best practice, but it made the script runnable by telegraf

Then I set up an exec config file for ethermine.py in /etc/telegraf.d/ called ethermine.conf

[[inputs.exec]]
command = "/usr/local/sbin/ethermine.py"
data_format = "json"
interval = "120s"
name_suffix = "-ethermine"

This is pretty straightforward, it tells telegraf to call ethermine.py every 2 minutes (checking the nice API documents show that this is the most often they update the data), expect the data to be returned in json format, and append -ethermine to ‘exec’ so that the data shows up in a separate field in the from selection in Grafana.

Once you have the config file in place test it:

sudo -u telegraf telegraf --config ethermine.conf --test

This should give you a nice line like:

* Plugin: inputs.exec, Collection 1
* Internal: 2m0s
> exec-ethermine,host=ubuntu staleShares=0,activeWorkers=1,reportedHashrate=25873123,usdPerMin=0.0006867597567563183,averageHashrate=26057870.370370366,invalidShares=0,lastSeen=1521771782,btcPerMin=0.00000008182049517386047,currentHashrate=30000000,time=1521772200,coinsPerMin=0.0000013243848360935654,unpaid=6379763169623989,validShares=27 1521772669000000000

That way you know its working, then restart the telegraf service.

sudo service telegraf restart

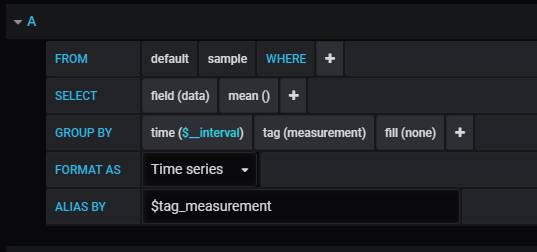
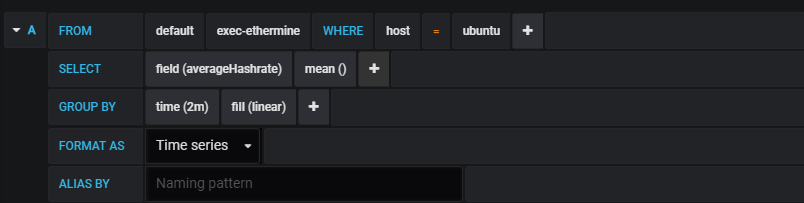
Now all you have to do is setup some queries that you like in Grafana.   Connect it to your influxdb (setup a read user first) and then I set up some queries like the following:

Hash Rate

Setup a couple of graphs on your dashboard, sit back, and watch your miner rake in the dough 🙂

Mining