Category Archives: Monitoring

Grafana Elasticsearch Moving Averages

If you’re working with Elasticsearch data in Grafana, you may want to add moving averages to your graphs to help visualize trends over time. However, the process for doing so is not always well-documented. Fortunately, it’s actually quite simple.

First, add a new metric to your graph. From there, select “MovingFunction” and choose the metric you want to average. Then, expand the options and set the window to the number of samples you want your moving function to be based on.

Next, you’ll need to provide a script for the moving function to use. Depending on your needs, you can choose from several different options, including:

  • MovingFunctions.max(values)
  • MovingFunctions.min(values)
  • MovingFunctions.sum(values)
  • MovingFunctions.unweightedAvg(values)
  • MovingFunctions.linearWeightedAvg(values)

Once you’ve selected the appropriate script, you should be able to see your moving average data displayed on your graph.

While adding moving averages to Elasticsearch data in Grafana can be a helpful way to visualize trends, it can also be frustrating if you’re not sure how to do it. By following these simple steps, you’ll be able to quickly and easily add moving averages to your graphs and gain deeper insights into your data.

References:
https://www.elastic.co/guide/en/elasticsearch/reference/current/search-aggregations-pipeline-movfn-aggregation.html#:~:text=The%20Moving%20Function%20aggregation%20allows,script%20in%20the%20values%20variable.

Python OAuth2 auth and bearer token caching

To access many APIs you need to use OAuth2, sending a client id and secret to an endpoint to get a token back. Then send that token with future calls as authentication.

The particular API I was calling would also return a number of seconds the bearer token would be good for.

Hopefully this code will help jumpstart someone else along the way to using python and APIs.

#!/usr/bin/env python3

import requests
import json
import datetime

import os.path
from os import path

cache_file = "/var/tmp/oauth.json"
client_id = '**your client_id here**'
client_secret = '**your secret here**'

def getToken():
    url = "https://api.wherever.com/oauth2/token"

    data = {
      'client_id': client_id,
      'client_secret': client_secret,
      'grant_type': 'client_credentials'
    }

    response = requests.post(url, data=data)

    data = json.loads(response.text)
    expiration_time =  datetime.datetime.now() +  datetime.timedelta(seconds=data['expires_in'])
    data['expiration_date'] =   int(expiration_time.utcnow().timestamp())

    with open(cache_file, "w") as outfile:
        json.dump(data, outfile)
    return data


if path.exists(cache_file):
    #Reading cache
    with open(cache_file, "r") as infile:
        access_token = json.load(infile)
    if int(datetime.datetime.now().timestamp()) > access_token['expiration_date']:
        #Token expired, get new
        access_token = getToken()
else:
    #No cached value, get and cache
    access_token = getToken()


bearer_token = access_token["access_token"]
headers = {
        'Authorization': f'bearer {bearer_token}'
}

#The rest of the requests go here and pass that header

4/24/2023: updated to fix typo!

Collecting MS SQL Query Data into Telegraf

Sometimes you just want to record results from a SQL query into Telegraf so you can graph it over time with Grafana. I have several queries that I want to see trend data for so I wrote this script to allow me to easily configure queries and throw them into a nice graph for analysis.

For the collection part I have a simple python script. I put the following in /usr/local/sbin/check_mssql.py

#! /usr/bin/env python

__author__ = 'Eric Hodges'
__version__= 0.1

import os, sys
import pymssql
import json
import configparser

from optparse import OptionParser, OptionGroup

parser = OptionParser(usage='usage: %prog [options]')
parser.add_option('-c', '--config', help="Config File Location", default="/etc/mssql_check.conf")

(options, args) = parser.parse_args()
config = configparser.ConfigParser()
config.read(options.config)

settings = config['Settings']
conn = pymssql.connect(host=settings['hostname'],user=settings['username'], password=settings['password'], database=settings['database'])

def return_dict_pair(cur, row_item):
    return_dict = {}
    for column_name, row in zip(cur.description, row_item):
        return_dict[column_name[0]] = row
    return return_dict

queries = config.sections()

items = []

for query in queries:
    if (query != 'Settings'):
        cursor = conn.cursor()

        cursor.execute(config[query]['query'])
        description = cursor.description

        row = cursor.fetchone()
        while row:
            items.append(return_dict_pair(cursor,row))
            row = cursor.fetchone()

conn.close()
print(json.dumps(items))

sys.exit()
<span id="mce_SELREST_start" style="overflow:hidden;line-height:0;"></span>

This script expects to be passed a config file on the command line i.e. ‘check_mssql.py –config test.conf’

The config file is very simple, it contains a Settings section with the database connection options, and then one section for each query you want to run. It runs the query and then converts the rows into a dictionary, then pushes each row onto an array. It repeats for each query adding them all to the same array and finally returns them as JSON. (Replace the right hand side of the = with the correct info). The query needs at least one column to be a string to serve as the key for telegraf.

Example test.conf config:

[Settings]
hostname=server[:port]
database=database_name
username=readonly_user
password=readonly_user_password

[Sample]
query=SELECT measurement, data FROM sample_table

You can make new section like Sample with different names and different queries and it will run them all and combine them together.

Then all we need to do is setup Telegraf to run this config (/etc/telegraf/telegraf.d/sample.conf):

[[inputs.exec]]
commands = ["/usr/local/sbin/check_mssql.py --config /etc/check_mssql/sccm.conf"]
tag_keys = ["measurement"]
interval = "60s"
data_format = "json"
name_override = "Sample"

Make sure to change the tag_keys and name_override to whatever you would like to be tags in Grafana. You can test the config by running ‘telegraf -test -config sample.conf’

Now in grafana choose your telegraf data source, then set the where to any tags you want, select one (or more of the fields) and off you go.

grafana


I hope you find this useful and can make many great graphs with it!

Collecting DHCP Scope Data with Grafana

In order to collect my DHCP scope statistics data into Grafana I turned to PowerShell.  We can use Get-DhcpServerv4Scope to list our all our scopes, Get-DhcpServerv4ScopeStatistics to get the stats for each, and then a little bit of regex and math to add some additional stats that we then bring into an InfluxDB, which then ultimately gets mapped be Grafana.

I have multiple sites, with multiple scopes, which ends up with tons and tones of data.  I already have Nagios alerts that tell me if individual scopes are in danger ranges of available IP’s etc, so for Grafana I was more interested in aggregated data about groups of scopes and how users in my network were changing.  In our case, the actual scope names are contained inside the parenthesis, so I used some regex to match scope names between parenthesis and then build a hash table of stats with those scope names and total up the free and used IPs in each range.

Enough chatter, here is the script:

Function Get-DHCPStatistics {
    Param(
        [string]$ComputerName=$env:computername,
        [string]$option
    )
    Process {
        # retrieve all scopes
        $scopes = Get-DhcpServerv4Scope -ComputerName $ComputerName -ErrorAction:SilentlyContinue 

        # setup all variables we are going to use
        $report = @{}
        $totalScopes = 0
        $totalFree =  0
        $totalInUse = 0

        ForEach ($scope In $scopes) {
            # We have multiple sites and include the scope name inside () at each scope
            # this aggregates scope data by name
            if ($scope.Name -match '.*\((.*)\).*') {
                $ScopeName = $Matches[1]
            } else {
                $ScopeName = $scope.Name
            }

            # initials a named scope if it doens't exist already
            if (!($report.keys -contains $ScopeName )) {
                $report[$ScopeName] = @{
                    Free = 0
                    InUse = 0
                    Scopes = 0
                }
            }

            $ScopeStatistics = Get-DhcpServerv4ScopeStatistics -ScopeID $scope.ScopeID -ComputerName $ComputerName -ErrorAction:SilentlyContinue
            $report[$ScopeName].Free += $ScopeStatistics.Free
            $report[$ScopeName].InUse += $ScopeStatistics.InUse
            $report[$ScopeName].Scopes += 1

            $totalFree += $ScopeStatistics.Free
            $totalInUse += $ScopeStatistics.InUse
            $totalScopes += 1
        }

        ForEach ($scope in $report.keys) {
            if ($report[$scope].InUse -gt 0) {
                [pscustomobject]@{
                    Name = $scope
                    Free = $report[$scope].Free
                    InUse = $report[$scope].InUse
                    Scopes = $report[$scope].Scopes
                    PercentFull = [math]::Round(100 *  $report[$scope].InUse / $report[$scope].Free , 2)
                    PercentOfTotal = [math]::Round( 100 * $report[$scope].InUse / $totalInUse, 2)
                }
            }
        }

        #Return one last summary object
        [pscustomobject]@{
            Name = "Total"
            Free = $totalFree
            InUse = $totalInUse
            Scopes = $totalScopes
            PercentFull = [math]::Round(100 *  $totalInUse / $totalFree , 2)
            PercentOfTotal = 0
         }

    }

}

Get-DHCPStatistics | ConvertTo-JSon

I then place that script on my DHCP server and use a telegraf service to run it and send data to InfluxDB. That config is pretty straightforward, aside from all the normal configuration to send it off, I just setup inputs.exec:

[[inputs.exec]]
  name_suffix = "_dhcp"
  commands = ['powershell c:\\GetDHCPStats.ps1']
  timeout = "60s"
  data_format = "json"
  tag_keys = ["Name"]

This is pretty easy, I tell it to expect JSON and the PowerShell was set up to output JSON. I also let it know that each record in the JSON will have one key labeled “Name” that will have the scope name in it. Honestly, this should probably be ScopeName and the PowerShell should be updated to reflect that as now my tags in InfluxDB are a bit polluted if anything else ever uses a tag of Name.

Once this is all done and configured, now my DHCP server is reporting statistics about our server into InfluxDB.

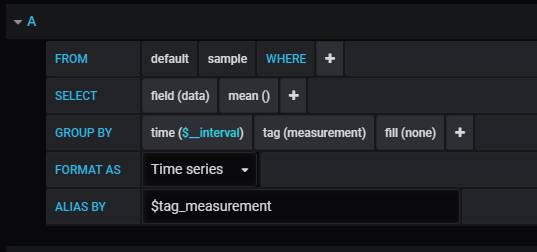
I then setup a graph in Grafana using this data. I just did a pretty straight forward graph that mapped each scopes percent of the total IPs that we use. It gives a nice easy way to see how the users on my network are moving around.  The source for the query ends up being something like:

SELECT mean("PercentOfTotal") FROM "exec_dhcp" WHERE ("Name" != 'Total') AND $timeFilter GROUP BY time($__interval), "Name" fill(linear)

This gives me a graph like the following (cropped to leave off some sensitive data):

DHCP Stats

Looks a little boring overall, but individual scope graphs can be kinda interesting and informative as to how the system in performing:


DHCP Stats1

This gives a fun view of one scope as devices join and then as lease are cleaned up, and new devices join again.

Hope this helps!