Tag Archives: Telegraf

Collecting MS SQL Query Data into Telegraf

Sometimes you just want to record results from a SQL query into Telegraf so you can graph it over time with Grafana. I have several queries that I want to see trend data for so I wrote this script to allow me to easily configure queries and throw them into a nice graph for analysis.

For the collection part I have a simple python script. I put the following in /usr/local/sbin/check_mssql.py

#! /usr/bin/env python

__author__ = 'Eric Hodges'
__version__= 0.1

import os, sys
import pymssql
import json
import configparser

from optparse import OptionParser, OptionGroup

parser = OptionParser(usage='usage: %prog [options]')
parser.add_option('-c', '--config', help="Config File Location", default="/etc/mssql_check.conf")

(options, args) = parser.parse_args()
config = configparser.ConfigParser()
config.read(options.config)

settings = config['Settings']
conn = pymssql.connect(host=settings['hostname'],user=settings['username'], password=settings['password'], database=settings['database'])

def return_dict_pair(cur, row_item):
    return_dict = {}
    for column_name, row in zip(cur.description, row_item):
        return_dict[column_name[0]] = row
    return return_dict

queries = config.sections()

items = []

for query in queries:
    if (query != 'Settings'):
        cursor = conn.cursor()

        cursor.execute(config[query]['query'])
        description = cursor.description

        row = cursor.fetchone()
        while row:
            items.append(return_dict_pair(cursor,row))
            row = cursor.fetchone()

conn.close()
print(json.dumps(items))

sys.exit()
<span id="mce_SELREST_start" style="overflow:hidden;line-height:0;"></span>

This script expects to be passed a config file on the command line i.e. ‘check_mssql.py –config test.conf’

The config file is very simple, it contains a Settings section with the database connection options, and then one section for each query you want to run. It runs the query and then converts the rows into a dictionary, then pushes each row onto an array. It repeats for each query adding them all to the same array and finally returns them as JSON. (Replace the right hand side of the = with the correct info). The query needs at least one column to be a string to serve as the key for telegraf.

Example test.conf config:

[Settings]
hostname=server[:port]
database=database_name
username=readonly_user
password=readonly_user_password

[Sample]
query=SELECT measurement, data FROM sample_table

You can make new section like Sample with different names and different queries and it will run them all and combine them together.

Then all we need to do is setup Telegraf to run this config (/etc/telegraf/telegraf.d/sample.conf):

[[inputs.exec]]
commands = ["/usr/local/sbin/check_mssql.py --config /etc/check_mssql/sccm.conf"]
tag_keys = ["measurement"]
interval = "60s"
data_format = "json"
name_override = "Sample"

Make sure to change the tag_keys and name_override to whatever you would like to be tags in Grafana. You can test the config by running ‘telegraf -test -config sample.conf’

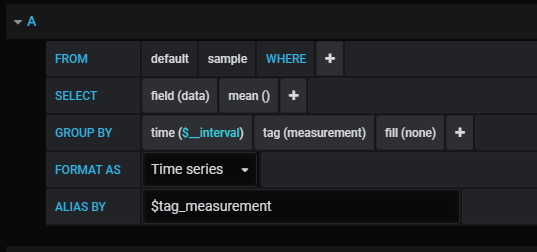
Now in grafana choose your telegraf data source, then set the where to any tags you want, select one (or more of the fields) and off you go.
grafana


I hope you find this useful and can make many great graphs with it!

Collecting DHCP Scope Data with Grafana

In order to collect my DHCP scope statistics data into Grafana I turned to PowerShell.  We can use Get-DhcpServerv4Scope to list our all our scopes, Get-DhcpServerv4ScopeStatistics to get the stats for each, and then a little bit of regex and math to add some additional stats that we then bring into an InfluxDB, which then ultimately gets mapped be Grafana.

I have multiple sites, with multiple scopes, which ends up with tons and tones of data.  I already have Nagios alerts that tell me if individual scopes are in danger ranges of available IP’s etc, so for Grafana I was more interested in aggregated data about groups of scopes and how users in my network were changing.  In our case, the actual scope names are contained inside the parenthesis, so I used some regex to match scope names between parenthesis and then build a hash table of stats with those scope names and total up the free and used IPs in each range.

Enough chatter, here is the script:

Function Get-DHCPStatistics {
    Param(
        [string]$ComputerName=$env:computername,
        [string]$option
    )
    Process {
        # retrieve all scopes
        $scopes = Get-DhcpServerv4Scope -ComputerName $ComputerName -ErrorAction:SilentlyContinue 

        # setup all variables we are going to use
        $report = @{}
        $totalScopes = 0
        $totalFree =  0
        $totalInUse = 0

        ForEach ($scope In $scopes) {
            # We have multiple sites and include the scope name inside () at each scope
            # this aggregates scope data by name
            if ($scope.Name -match '.*\((.*)\).*') {
                $ScopeName = $Matches[1]
            } else {
                $ScopeName = $scope.Name
            }

            # initials a named scope if it doens't exist already
            if (!($report.keys -contains $ScopeName )) {
                $report[$ScopeName] = @{
                    Free = 0
                    InUse = 0
                    Scopes = 0
                }
            }

            $ScopeStatistics = Get-DhcpServerv4ScopeStatistics -ScopeID $scope.ScopeID -ComputerName $ComputerName -ErrorAction:SilentlyContinue
            $report[$ScopeName].Free += $ScopeStatistics.Free
            $report[$ScopeName].InUse += $ScopeStatistics.InUse
            $report[$ScopeName].Scopes += 1

            $totalFree += $ScopeStatistics.Free
            $totalInUse += $ScopeStatistics.InUse
            $totalScopes += 1
        }

        ForEach ($scope in $report.keys) {
            if ($report[$scope].InUse -gt 0) {
                [pscustomobject]@{
                    Name = $scope
                    Free = $report[$scope].Free
                    InUse = $report[$scope].InUse
                    Scopes = $report[$scope].Scopes
                    PercentFull = [math]::Round(100 *  $report[$scope].InUse / $report[$scope].Free , 2)
                    PercentOfTotal = [math]::Round( 100 * $report[$scope].InUse / $totalInUse, 2)
                }
            }
        }

        #Return one last summary object
        [pscustomobject]@{
            Name = "Total"
            Free = $totalFree
            InUse = $totalInUse
            Scopes = $totalScopes
            PercentFull = [math]::Round(100 *  $totalInUse / $totalFree , 2)
            PercentOfTotal = 0
         }

    }

}

Get-DHCPStatistics | ConvertTo-JSon

I then place that script on my DHCP server and use a telegraf service to run it and send data to InfluxDB. That config is pretty straightforward, aside from all the normal configuration to send it off, I just setup inputs.exec:

[[inputs.exec]]
  name_suffix = "_dhcp"
  commands = ['powershell c:\\GetDHCPStats.ps1']
  timeout = "60s"
  data_format = "json"
  tag_keys = ["Name"]

This is pretty easy, I tell it to expect JSON and the PowerShell was set up to output JSON. I also let it know that each record in the JSON will have one key labeled “Name” that will have the scope name in it. Honestly, this should probably be ScopeName and the PowerShell should be updated to reflect that as now my tags in InfluxDB are a bit polluted if anything else ever uses a tag of Name.

Once this is all done and configured, now my DHCP server is reporting statistics about our server into InfluxDB.

I then setup a graph in Grafana using this data. I just did a pretty straight forward graph that mapped each scopes percent of the total IPs that we use. It gives a nice easy way to see how the users on my network are moving around.  The source for the query ends up being something like:

SELECT mean("PercentOfTotal") FROM "exec_dhcp" WHERE ("Name" != 'Total') AND $timeFilter GROUP BY time($__interval), "Name" fill(linear)

This gives me a graph like the following (cropped to leave off some sensitive data):

DHCP Stats

Looks a little boring overall, but individual scope graphs can be kinda interesting and informative as to how the system in performing:


DHCP Stats1

This gives a fun view of one scope as devices join and then as lease are cleaned up, and new devices join again.

Hope this helps!

Setup Telegraf+InfluxDB+Grafana to Monitor Windows

Monitoring Windows with Grafana is pretty easy, but there are multiple systems that have to be set up to work together.

Prerequisites:

  • Grafana
  • InfluxDB

Main Steps:

  1. Create an InfluxDB database and users for Telegraf and Grafana
  2. Install Telegraf on Windows and configure it
  3. Setup a data source and dashboards in Grafana

It really sounds more daunting than it is

InfluxDB setup

We want to create an InfluxDB database,  create a user for telegraf to write data into influx, and a user for Grafana to read data out of influx.  From an SSH terminal, the commands will be

influx
CREATE DATABASE telegraf
CREATE USER telegraf WITH PASSWORD 'telegraf123'
CREATE USER grafana WITH PASSWORD 'grafana123'
GRANT WRITE ON telegraf TO telegraf 
GRANT READ ON telegraf TO grafana

Install Telegraf

You can go to https://portal.influxdata.com/downloads to get links download the client for different OS’s. Grab the link for windows, which at this time is https://dl.influxdata.com/telegraf/releases/telegraf-1.5.3_windows_amd64.zip and download that file using whatever method suits you best.   Extra the contents to a location you like,  I use c:\Program Files\telegraf\.  now you will need to modify the contents of telegraf.conf, I like to use Notepad++ but any text editor should be fine.

I like to modify the section called [global_tags] and put machine identifiers in there.

[global_tags]
 environment = "production"

You can add as many different tags under there as you would like, it takes some time to figure out what will be useful here.

When you have that completed, update the section for InfluxDB with the needed info. Make sure to update the IP and the passwords to the correct ones for your install.  Also if needed on the destination machine add the port 8086

# Configuration for influxdb server to send metrics to
[[outputs.influxdb]]
 urls = ["http://192.168.86.167:8086"] # required
 database = "telegraf" # required
 precision = "s"
 timeout = "5s"
 username = "telegraf"
 password = "telegraf123"

Now run a command prompt as administrator. Change to the directory where you have telegraf and its config file and run the following command to test your config:

C:\Program Files\telegraf>telegraf.exe --config telegraf.conf --test

The output should include a bunch of lines like the following:

 >win_perf_counters,instance=Intel[R]\ Ethernet\ Connection\ [2]\ I219-V,objectname=Network\ Interface,host=DESKTOP-MAIN Packets_Received_Errors=0 1522202369000000000
 > win_perf_counters,instance=Qualcomm\ Atheros\ QCA61x4A\ Wireless\ Network\ Adapter,objectname=Network\ Interface,host=DESKTOP-MAIN Packets_Received_Errors=0 1522202369000000000
 > win_perf_counters,instance=Teredo\ Tunneling\ Pseudo-Interface,objectname=Network\ Interface,host=DESKTOP-MAIN Packets_Received_Errors=0 1522202369000000000
 > win_perf_counters,objectname=Network\ Interface,host=DESKTOP-MAIN,instance=Intel[R]\ Ethernet\ Connection\ [2]\ I219-V Packets_Outbound_Discarded=0 1522202369000000000
 > win_perf_counters,objectname=Network\ Interface,host=DESKTOP-MAIN,instance=Qualcomm\ Atheros\ QCA61x4A\ Wireless\ Network\ Adapter Packets_Outbound_Discarded=0 1522202369000000000
 > win_perf_counters,instance=Teredo\ Tunneling\ Pseudo-Interface,objectname=Network\ Interface,host=DESKTOP-MAIN Packets_Outbound_Discarded=0 1522202369000000000
 > win_perf_counters,instance=Intel[R]\ Ethernet\ Connection\ [2]\ I219-V,objectname=Network\ Interface,host=DESKTOP-MAIN Packets_Outbound_Errors=0 1522202369000000000
 > win_perf_counters,instance=Qualcomm\ Atheros\ QCA61x4A\ Wireless\ Network\ Adapter,objectname=Network\ Interface,host=DESKTOP-MAIN Packets_Outbound_Errors=0 1522202369000000000
 > win_perf_counters,instance=Teredo\ Tunneling\ Pseudo-Interface,objectname=Network\ Interface,host=DESKTOP-MAIN Packets_Outbound_Errors=2 1522202369000000000

If it doesn’t, it should include error information that will help you determine what the issue is.  Once that works, you can then install telegraf as a service by running the following:

C:\Program Files\telegraf>telegraf.exe --service install

The service will not start automatically the first time however,  so then to start it run

net start telegraf

Now you should have telegraf collecting data from windows on a regular basis and dumping that data into InfluxDB, the only thing remaining is to graph it

Grafana Setup

In Grafana, set up a new data source.  It should look like the following:

teelgraf source

Once that is set up, then you can go create a dashboard and add a graph.  I created the following graph:

Windows CPU Graph

The query is:

SELECT mean("Percent_Processor_Time") FROM "win_cpu" WHERE ("host" = 'DESKTOP-MAIN' AND "instance" != '_Total') AND time >= now() - 5m GROUP BY time(500ms), "instance" fill(linear)

This basically tells InfluxDB to go get all of the win_cpu values where the host tag is set as “DESKTOP-MAIN” and the counter instance is not _Total.  For CPU values this means it gets the individual totals so that I can graph each CPU. Make that an equals instead and you’ll get just the overall CPU usage instead of the breakdown.

Then I group by tag(instance) which is how you get one line (or series) per CPU (performance counter).  After that, I use an alias by to make the name “CPU ” followed by the instance value.  If you don’t do that, you end up with some funky named series that just aren’t pretty to look at.   If anyone finds this interesting (or even if they don’t probably) I will make a post about how to use template variables to generate a whole dashboard of graphs for a whole set of hosts automagically.

This is a lot the first time you do it, maybe even the second.  But it really pays off and gives you some amazing ways to monitor computers and servers and pays off big in the end.

Using Python,Telegraf and Grafana to monitor your Ethermine.org miner!

I have a couple mining computers going and compulsion to Grafana everything that comes along. So I wondered how hard it would be to track my miner with Grafana and it turns out, not hard at all.  I use ethermine and they actually provide an API that allows you to call it with your miners address and it returns all sorts of stats, they also have some of the best documentation I’ve seen, and a site to let you test calls to their API (https://api.ethermine.org/docs/)    Heading over there I found that I wanted to make calls to miner/{mineraddress}/currentStats to get the juicy information I wanted, the info I wanted was returned in JSON and it would be in the data key… Well that’s easy enough, it’s not the prettiest script, and it doesn’t check for errors but here it is

#!/usr/bin/env python
import json
import requests

key = '{mineraddress}'
url = 'https://api.ethermine.org/miner/' + key + '/currentStats'

stats = requests.get(url)

print json.dumps(json.loads(stats.text)['data'])

Replace {mineraddress} with your miner address, and run it, and there you go.

You should get something back similar to

{"averageHashrate": 26047453.703703698, "usdPerMin": 0.0006877163189934768, "unpaid": 6366263118749017, "staleShares": 0, "activeWorkers": 1, "btcPerMin": 8.165787167840064e-08, "invalidShares": 0 , "validShares": 29, "lastSeen": 1521771528, "time": 1521771600, "coinsPerMin": 1.3241101293724766e-06, "reportedHashrate": 25752099, "currentHashrate": 32222222.222222224, "unconfirmed": null}


Which shows that currently, I’m making 0.0006 $/minute so I’ll be rich very very soon!

Now all I needed was to get this into Grafana,  my current database of choice has been InfluxDB, mostly because that is what I’ve been using, and the current collector of choice Telegraf.

So I:

  1. Setup influxdb
  2. Created a database for telegraf
  3. Created a write user for telegraf
  4. Setup telegraf
  5. Configured telegraf to use its user and write to influxdb

With that all done (that is basic setup needed for Grafana and I will probably cover it some other time)

I needed a telegraf collector for ethermine.  I moved my ethermine script to /usr/local/sbin and changed then ran

chown telegraf ethermine.py

This might not be the best practice, but it made the script runnable by telegraf

Then I set up an exec config file for ethermine.py in /etc/telegraf.d/ called ethermine.conf

[[inputs.exec]]
command = "/usr/local/sbin/ethermine.py"
data_format = "json"
interval = "120s"
name_suffix = "-ethermine"

This is pretty straightforward, it tells telegraf to call ethermine.py every 2 minutes (checking the nice API documents show that this is the most often they update the data), expect the data to be returned in json format, and append -ethermine to ‘exec’ so that the data shows up in a separate field in the from selection in Grafana.

Once you have the config file in place test it:

sudo -u telegraf telegraf --config ethermine.conf --test

This should give you a nice line like:

* Plugin: inputs.exec, Collection 1
* Internal: 2m0s
> exec-ethermine,host=ubuntu staleShares=0,activeWorkers=1,reportedHashrate=25873123,usdPerMin=0.0006867597567563183,averageHashrate=26057870.370370366,invalidShares=0,lastSeen=1521771782,btcPerMin=0.00000008182049517386047,currentHashrate=30000000,time=1521772200,coinsPerMin=0.0000013243848360935654,unpaid=6379763169623989,validShares=27 1521772669000000000

That way you know its working, then restart the telegraf service.

sudo service telegraf restart

Now all you have to do is setup some queries that you like in Grafana.   Connect it to your influxdb (setup a read user first) and then I set up some queries like the following:

Hash Rate

Setup a couple of graphs on your dashboard, sit back, and watch your miner rake in the dough 🙂

Mining